Powerful analytics to improve business KPIs

Empower employees to make sense of the data with simple yet powerful visualizations. Our visual builder helps you create reporting dashboards from scratch without knowing any query language. Interactive charts, gauges, tables, and more help you visualize and analyze your business data.

Contact us

Data analysis made fast and simple

Max_ROI

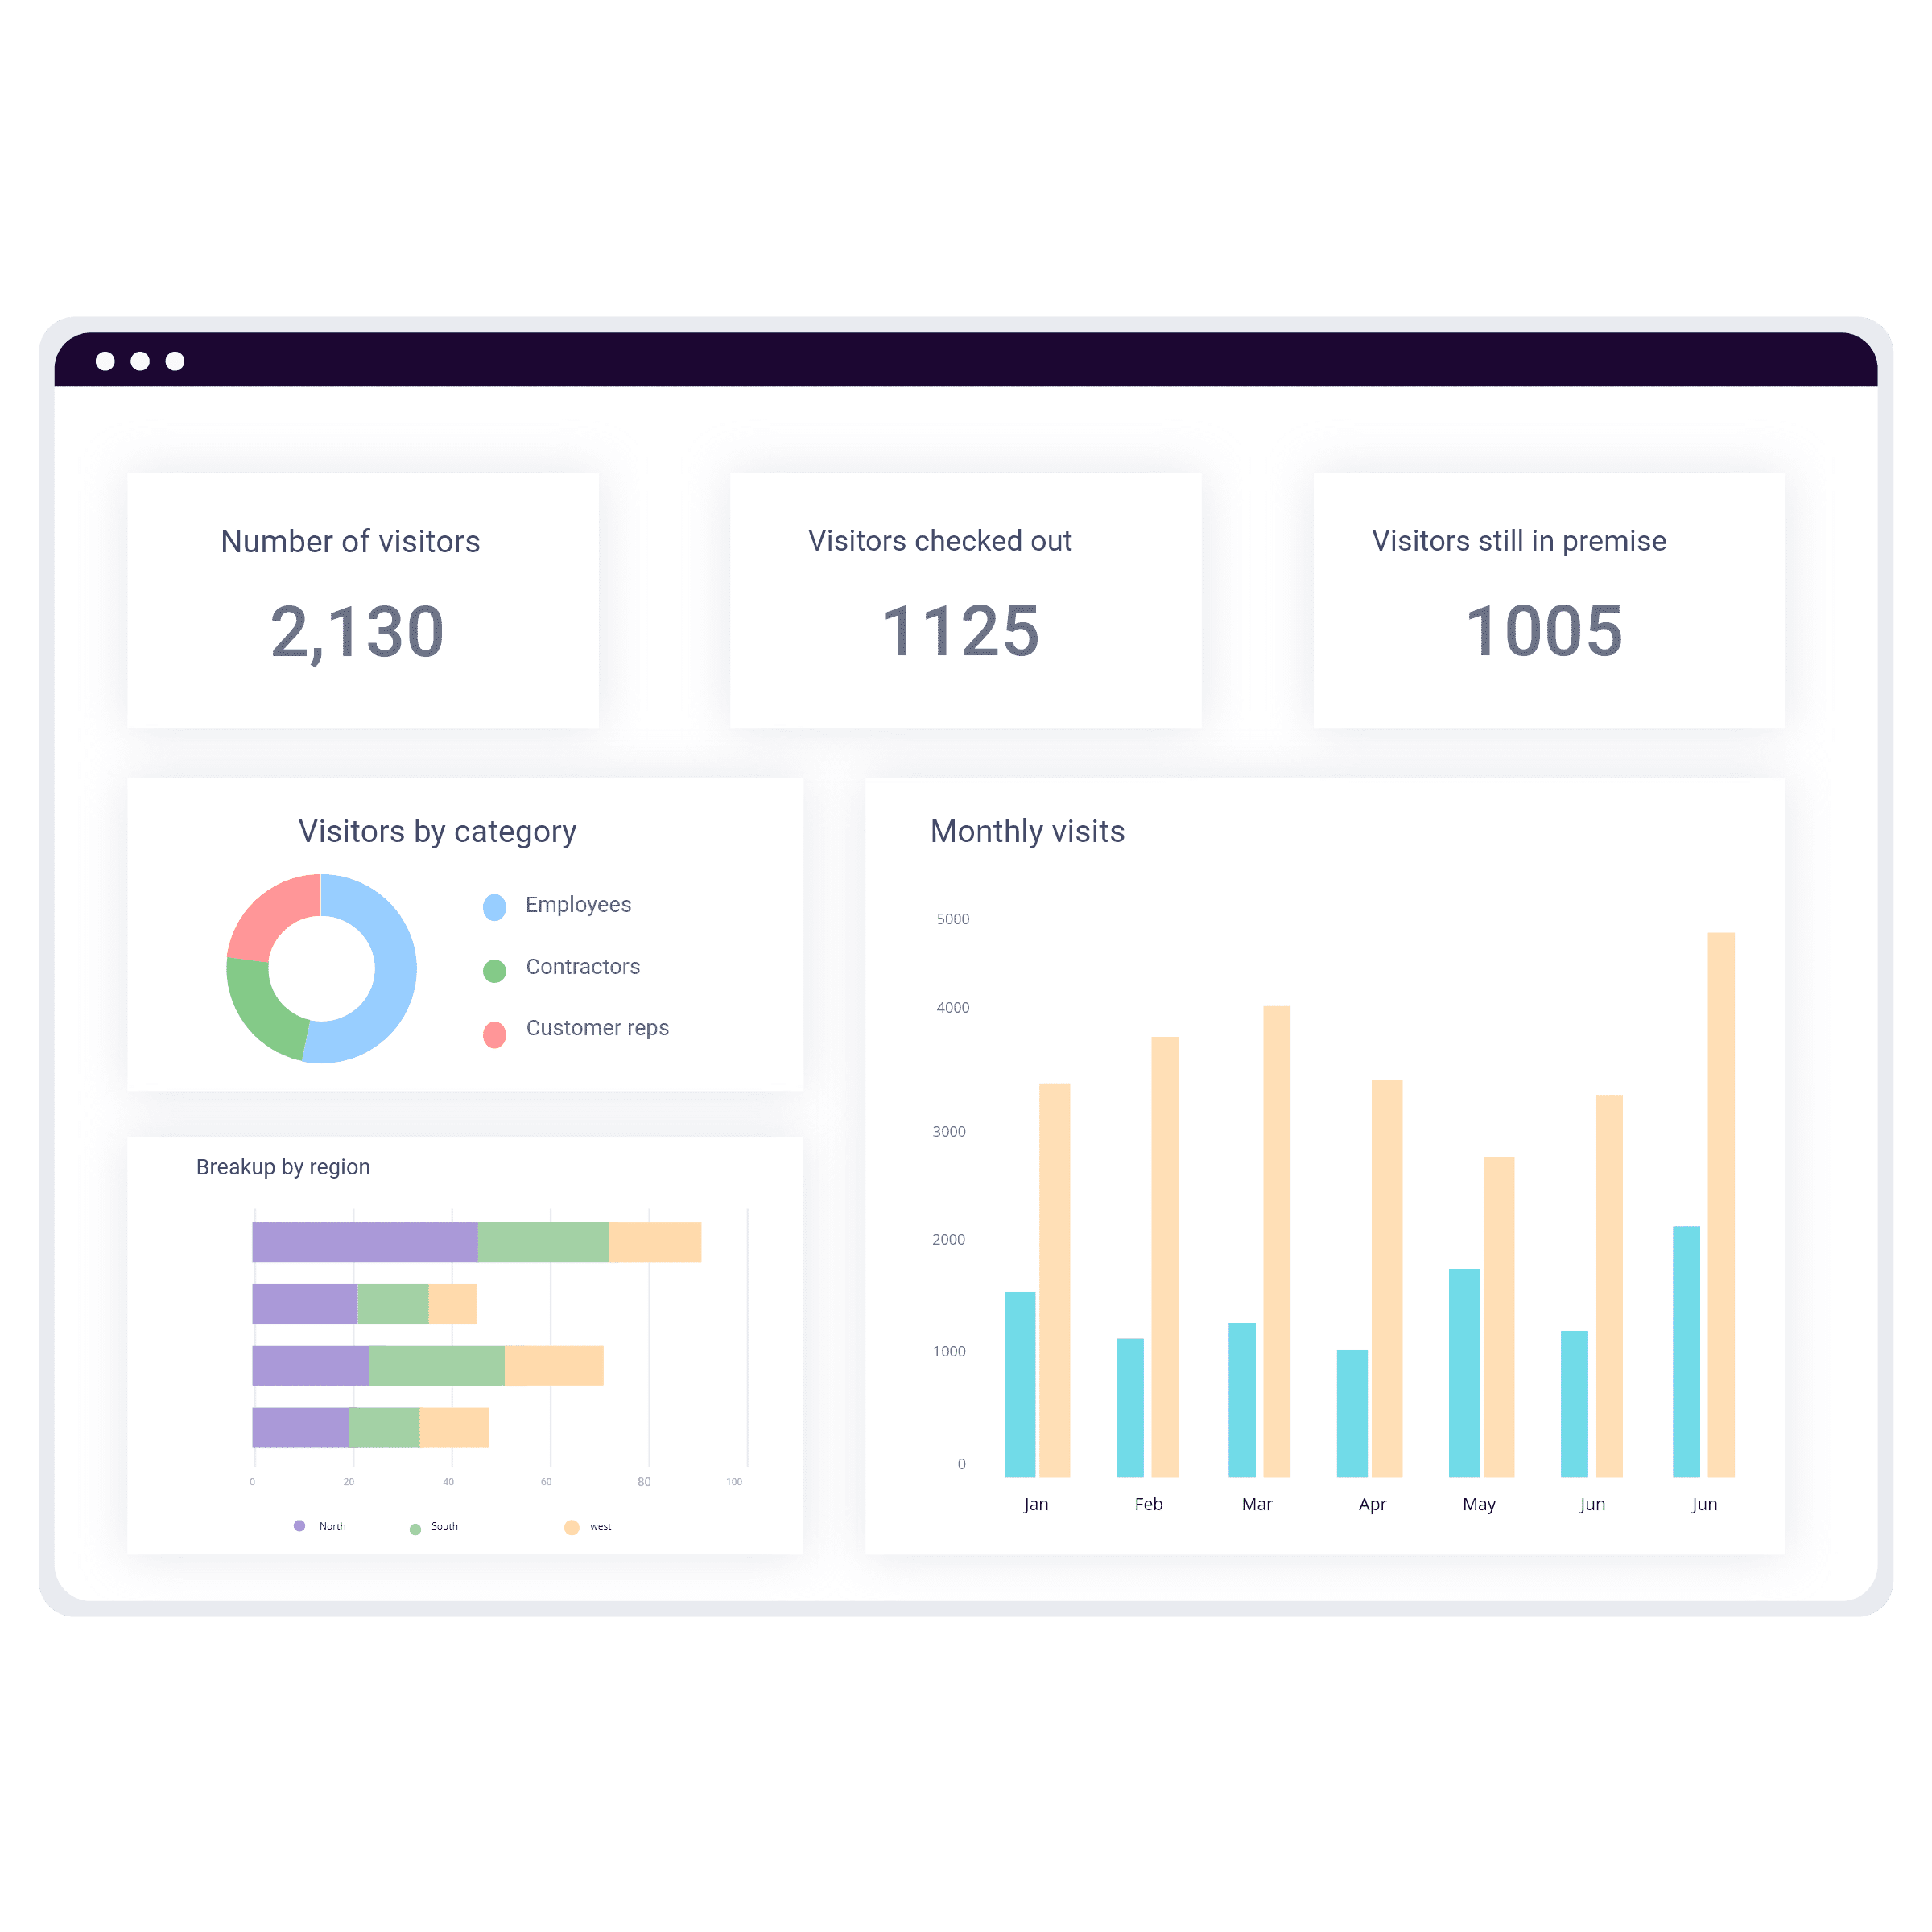
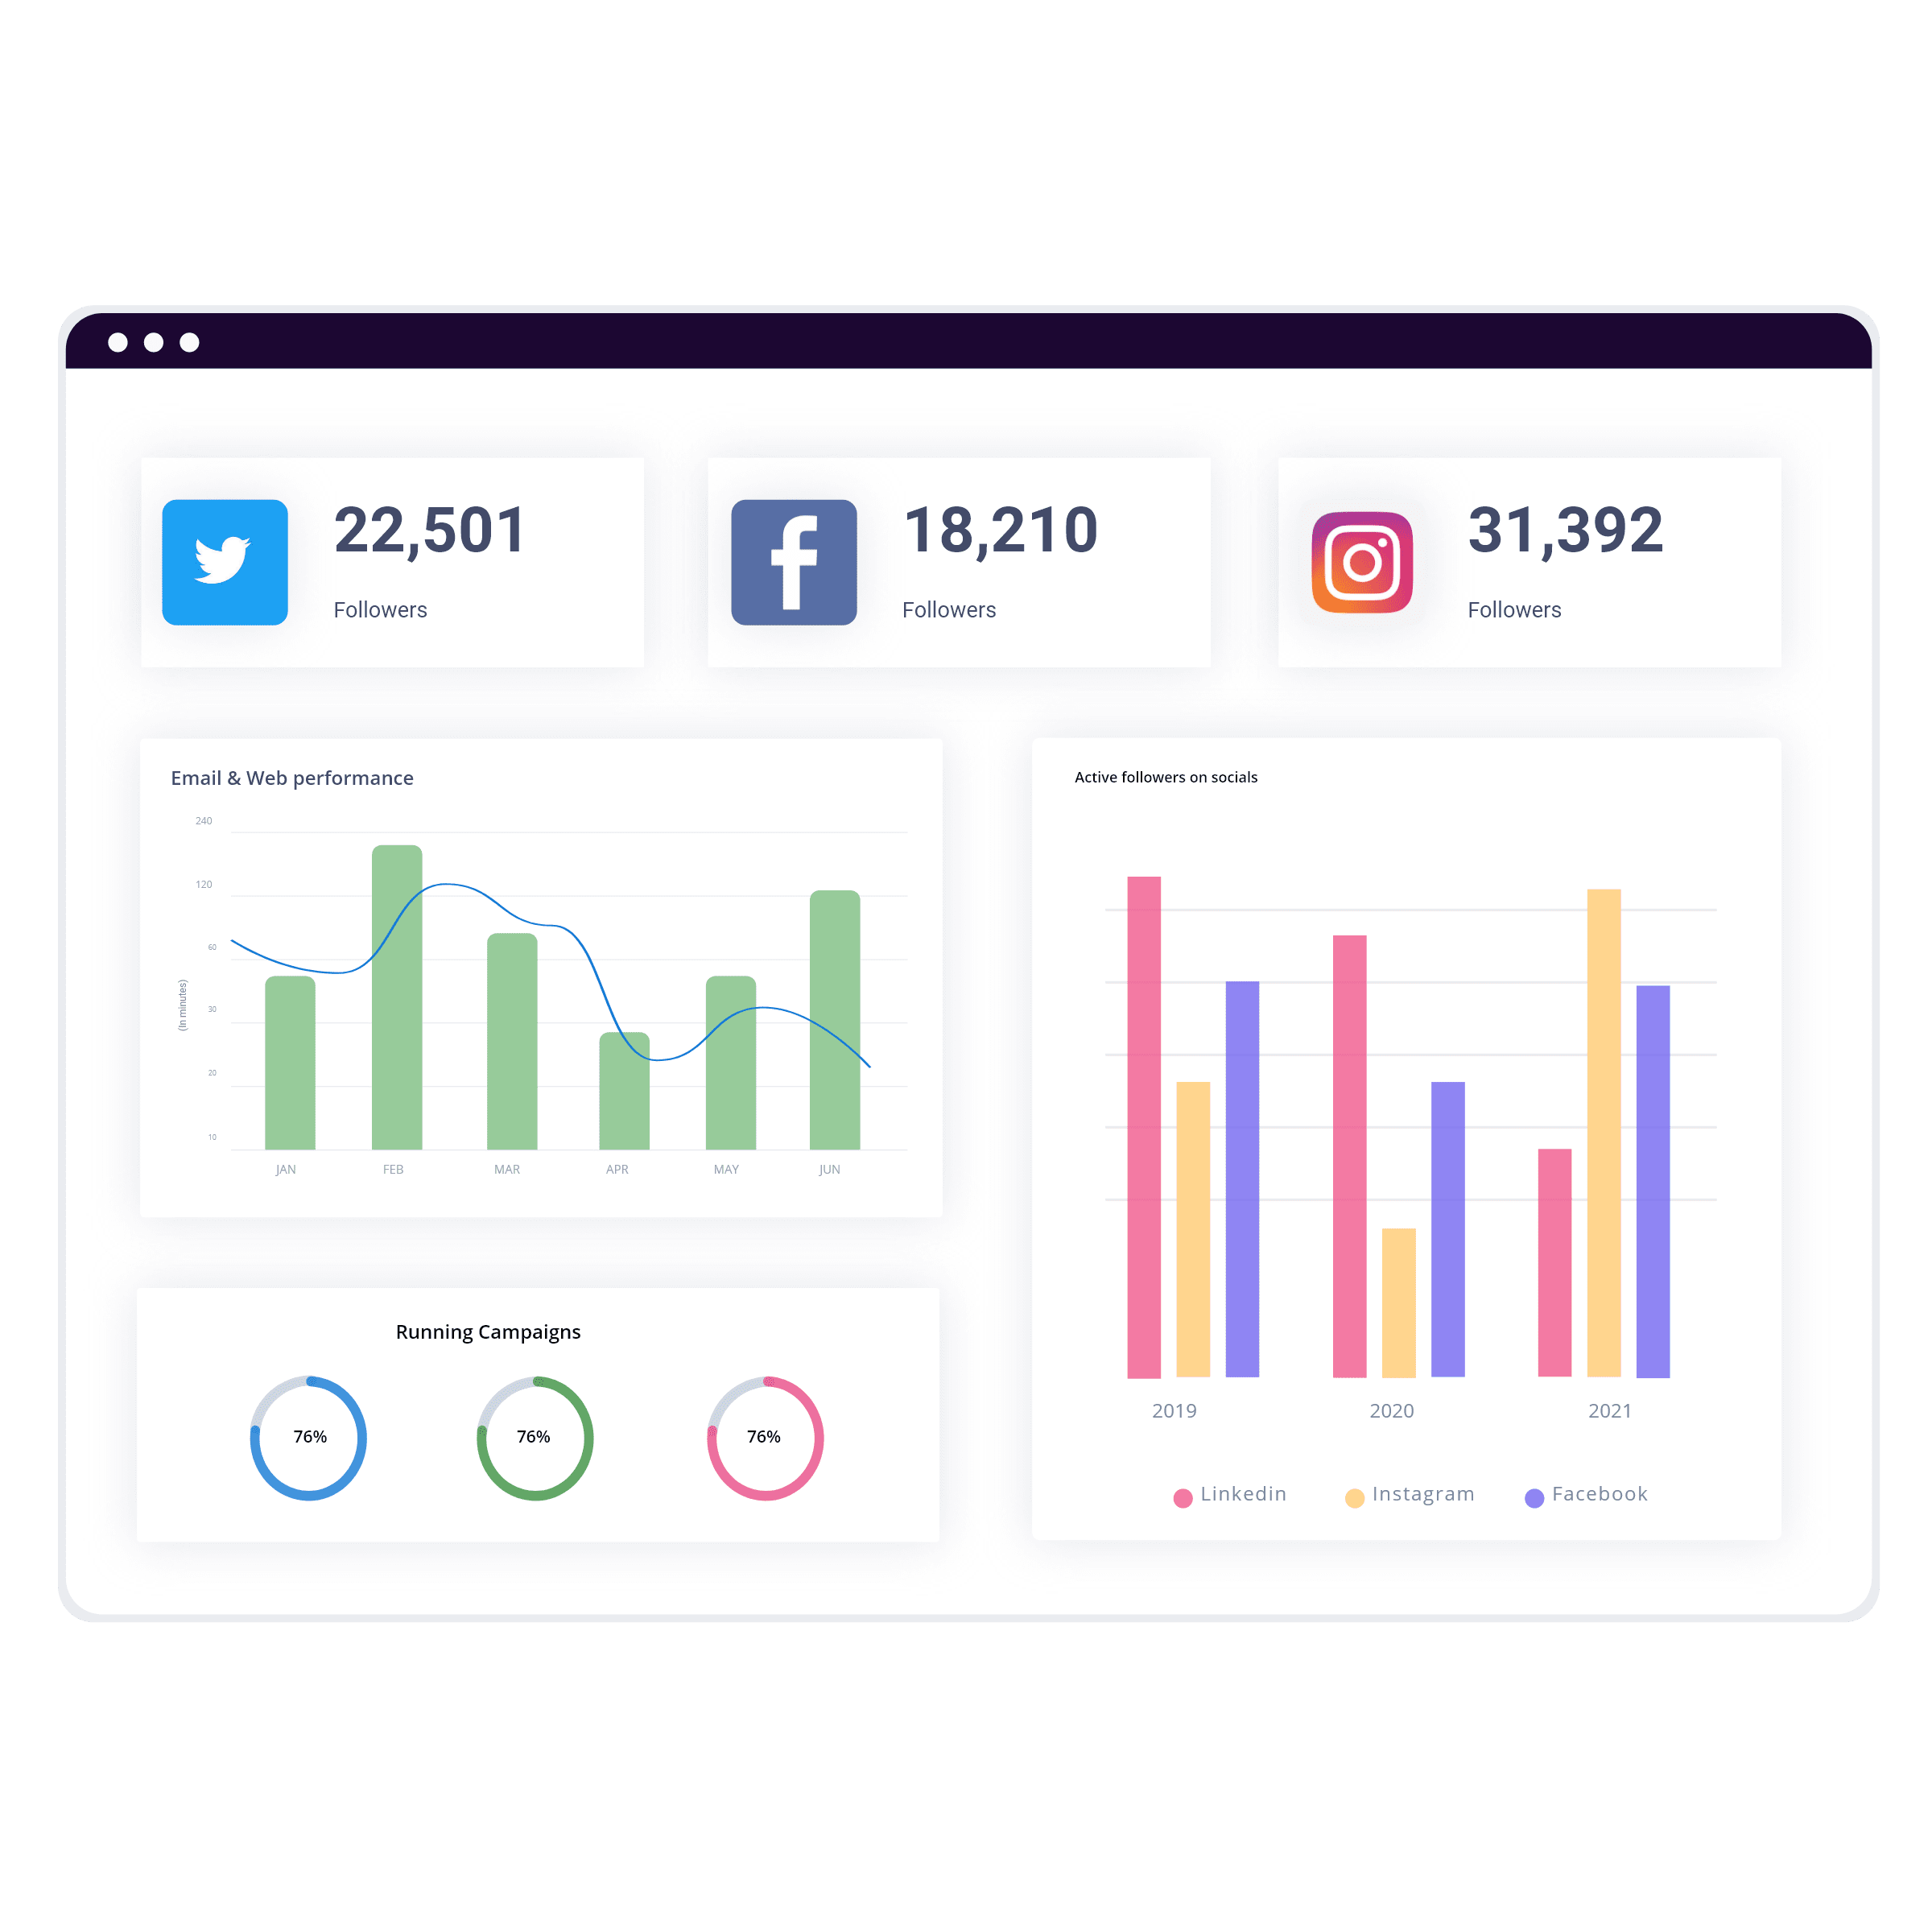
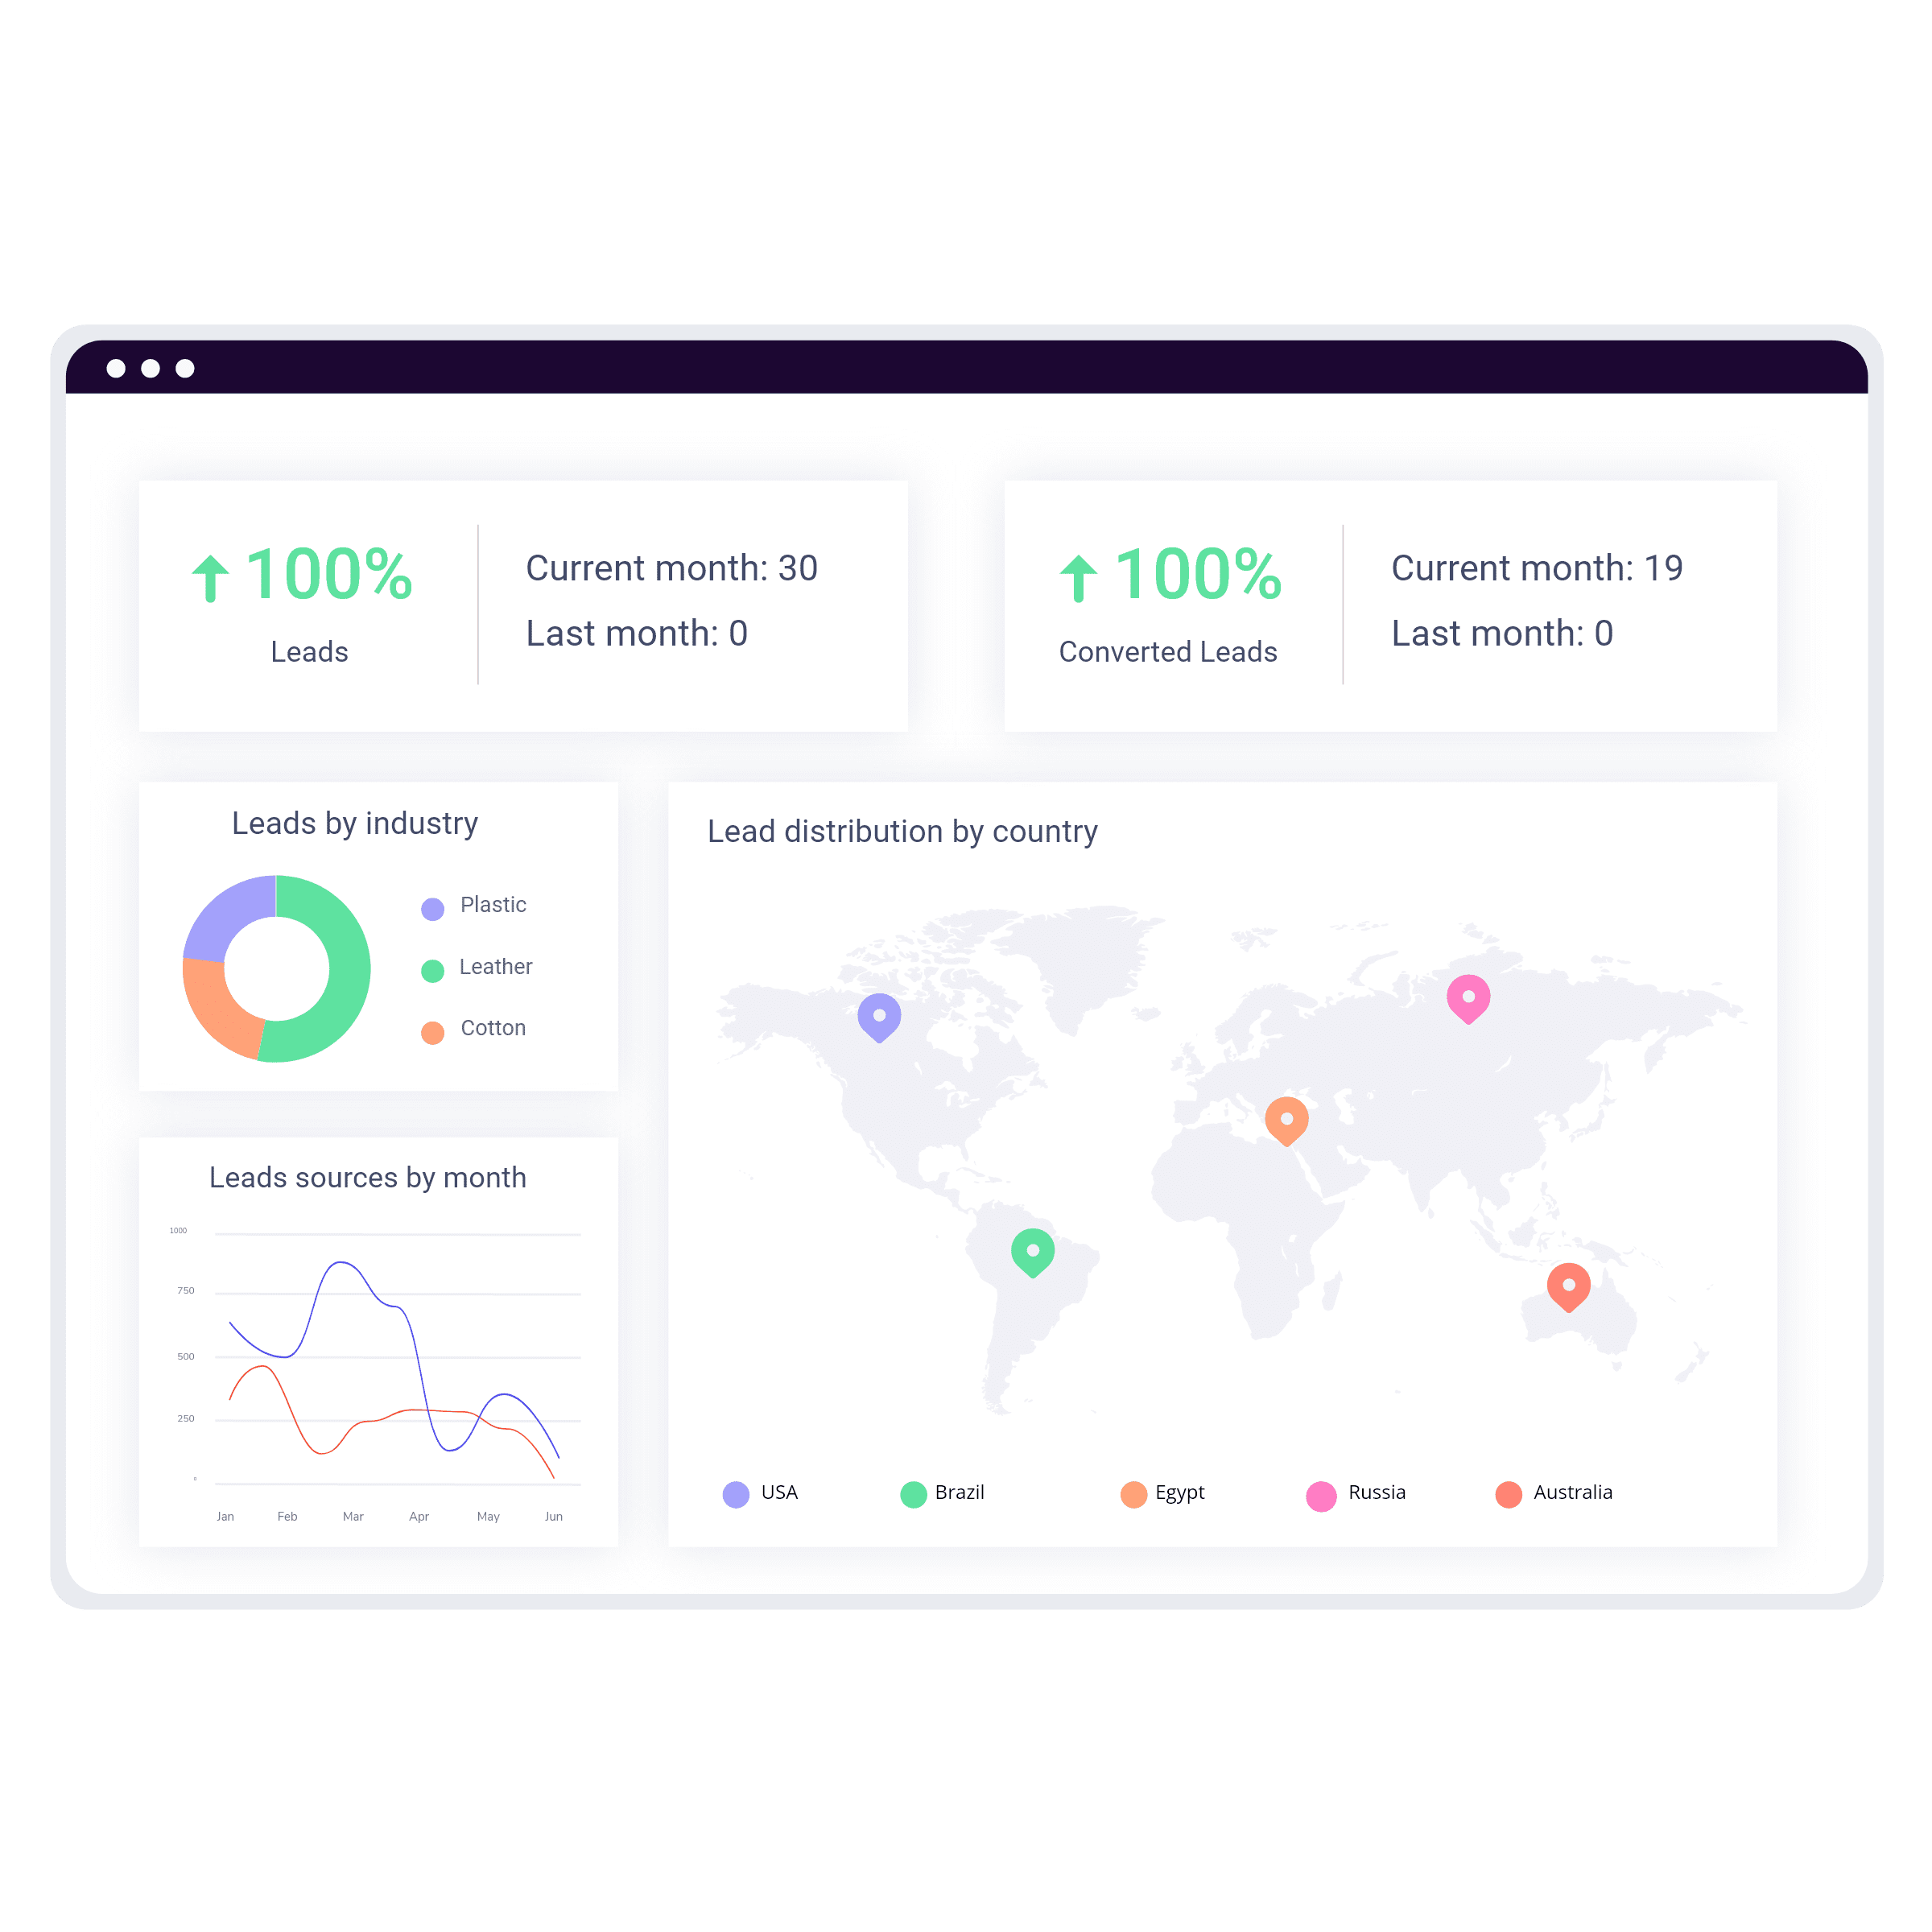
Effective visualizations

Tailor-made reports with 40+ charts that suit your business needs with extensive customizability.

Max_ROI

No coding skills required

Visual drag and drop report builder helps you to create reports without learning any query language.

Max_ROI

Access anytime, anywhere

View and share the report with an individual or the entire organization over email, mobile, or desktop devices.

Design beautiful dashboards with support for more than 40+ Chart Types

Visualize reports in a way that is easy to understand and helps you make decisions effortlessly

Drill down into details and uncover opportunities

Interlink reports to directly inspect individual sets of data contributing to different metrics of the report

Works across all devices - even on the go

Enable users to access reports on their laptops, Android and iOS devices

Effortless sharing and fine access control

Seamlessly share reports across the organization while possessing complete control over the sharing of sensitive data with role based access control

Empower your team to be citizen developers

Build the software faster without coding skills with our drag and drop visualization

Setup pre defined filters for users to slice and dice data

  • checkMark

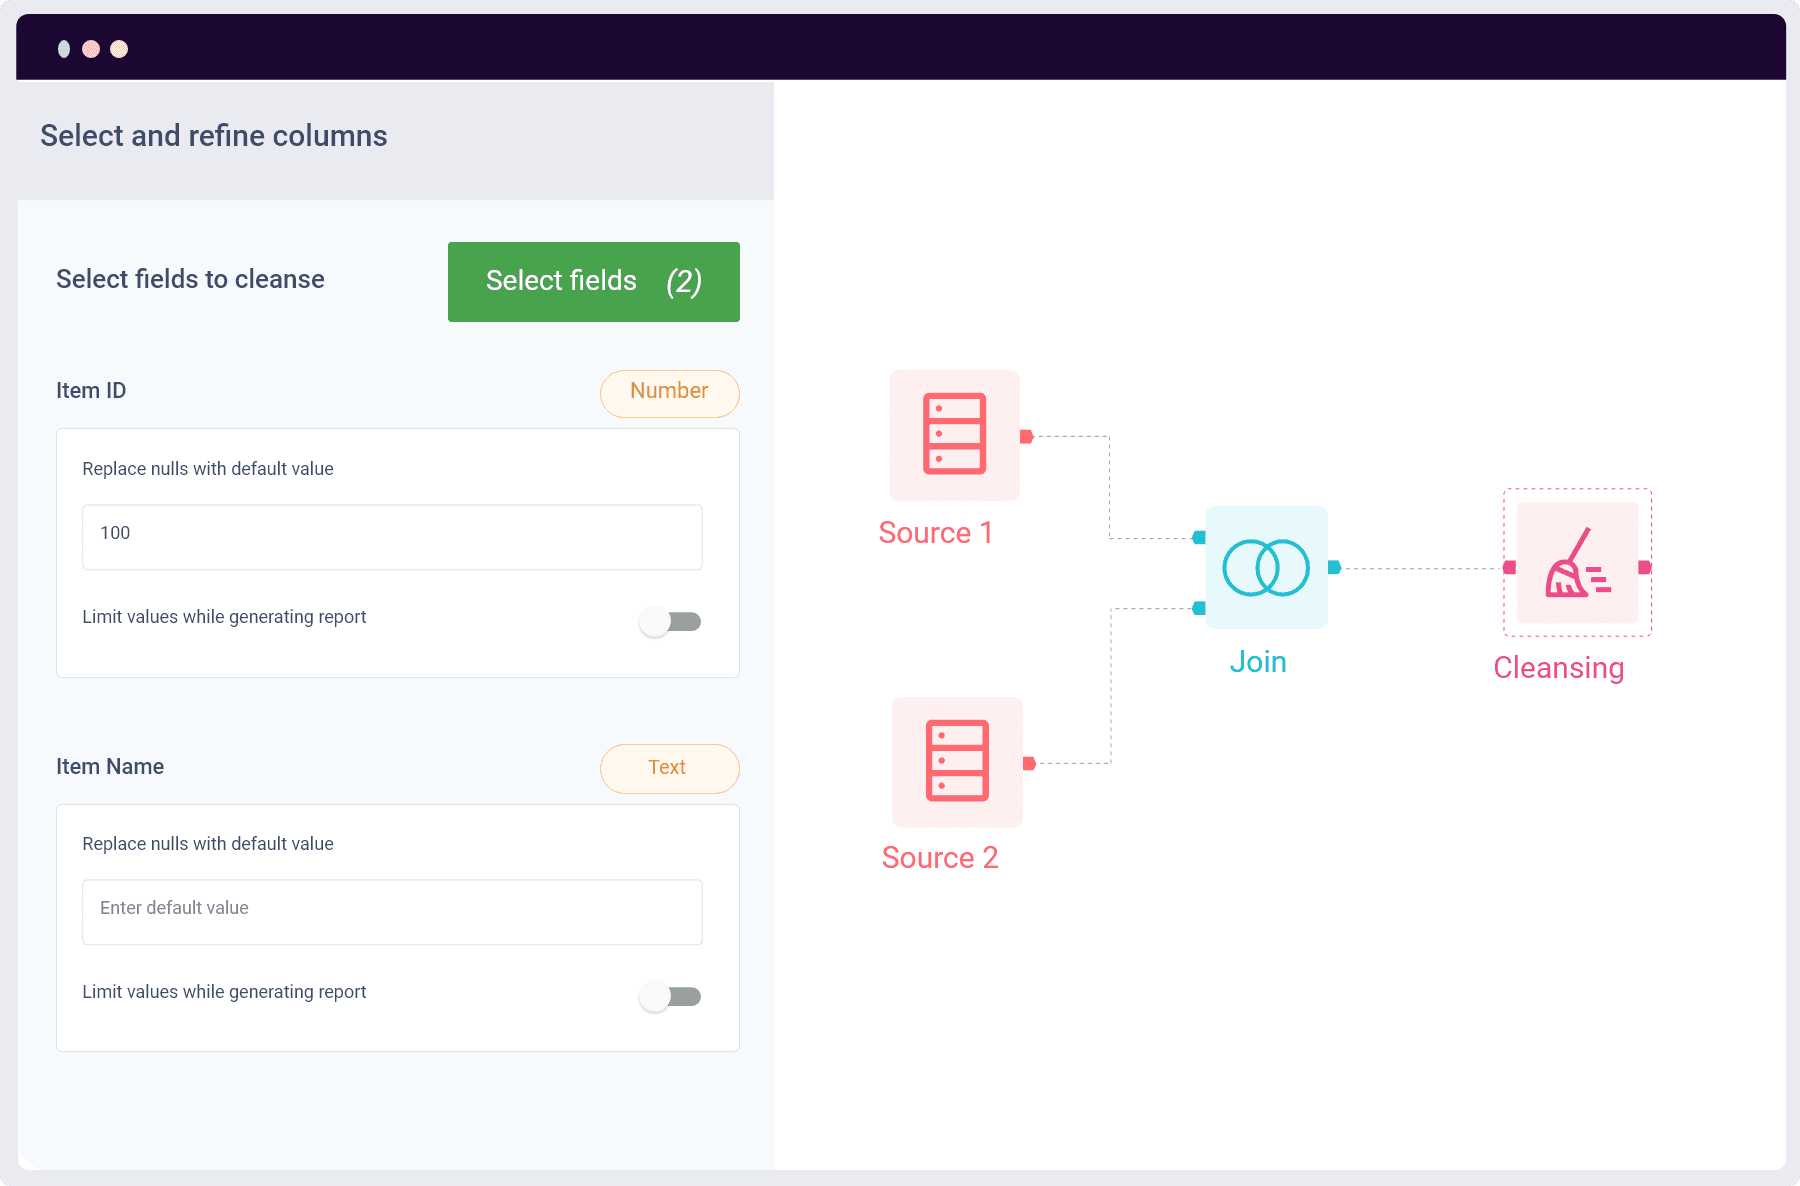
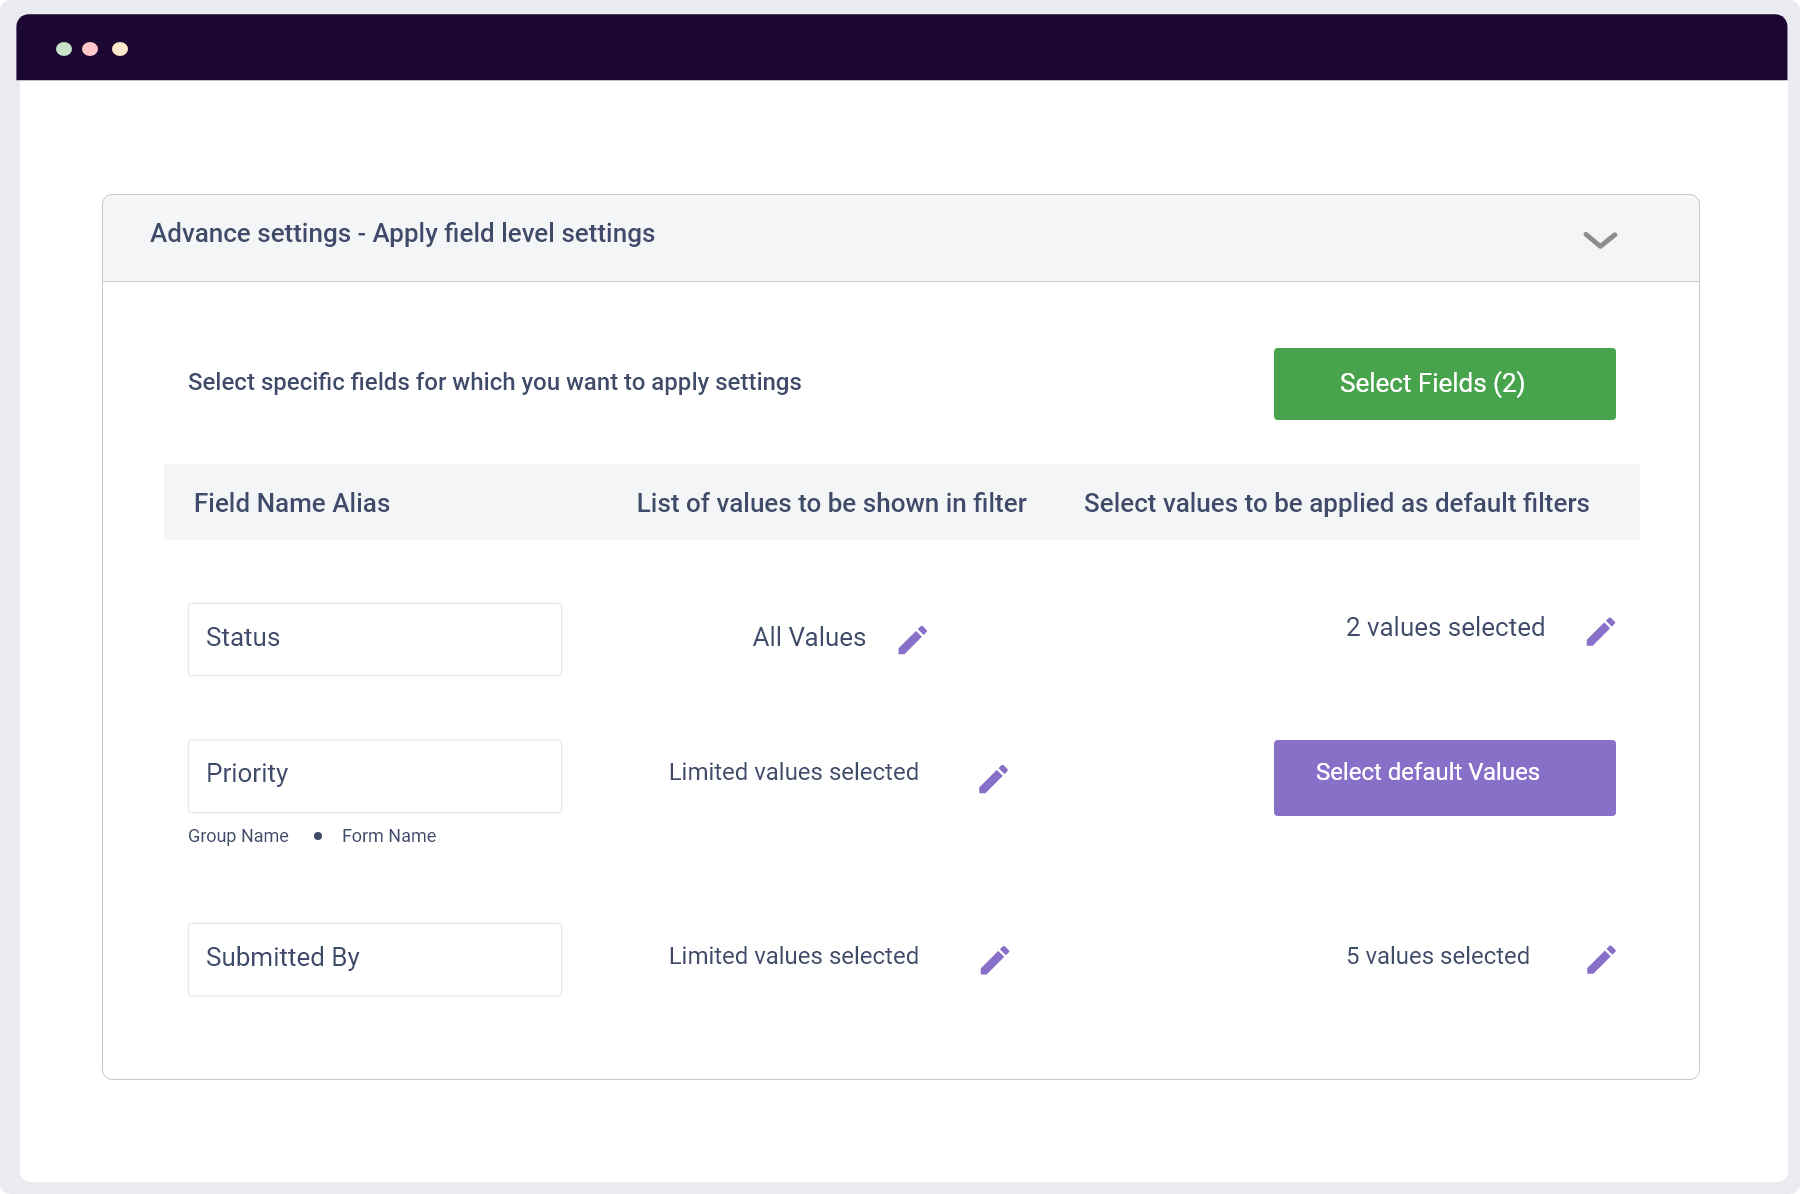
    Profile based dynamic filters

  • checkMark

    Auto applied filters on report load

  • checkMark

    30+ data type filters

#

Send data to your preferred visualization tool

Interlink reports to directly inspect individual sets of data contributing to different metrics of the report

Make all functions of your business data driven

HR Analytics

Enable HR leaders to develop data-driven insights for informed talent decisions, improved workforce processes and promote positive employee experience.

Operations KPI

Modern & efficient way to create powerful analysis, bring complex data into simple visuals, and employing them to make actionable decisions. Bring the indispensable value out of the overall business development, by concentrating on the most important business question: what can you do to perform even better?

Marketing ROI

Attribute profit and revenue growth to the impact of marketing initiatives by calculating return on marketing investment & measure the degree to which marketing efforts either holistically, or on a campaign-basis, contribute to revenue growth. Justify marketing spends and budget allocation for ongoing and future campaigns and initiatives.

Lead conversion

Converts your leads into customers through nurturing tactics like behavior automation, retargeting, and email nurturing.

Frequently Asked Questions

What types of charts are supported in the Senpiper One Resource platform?

#closeIcon

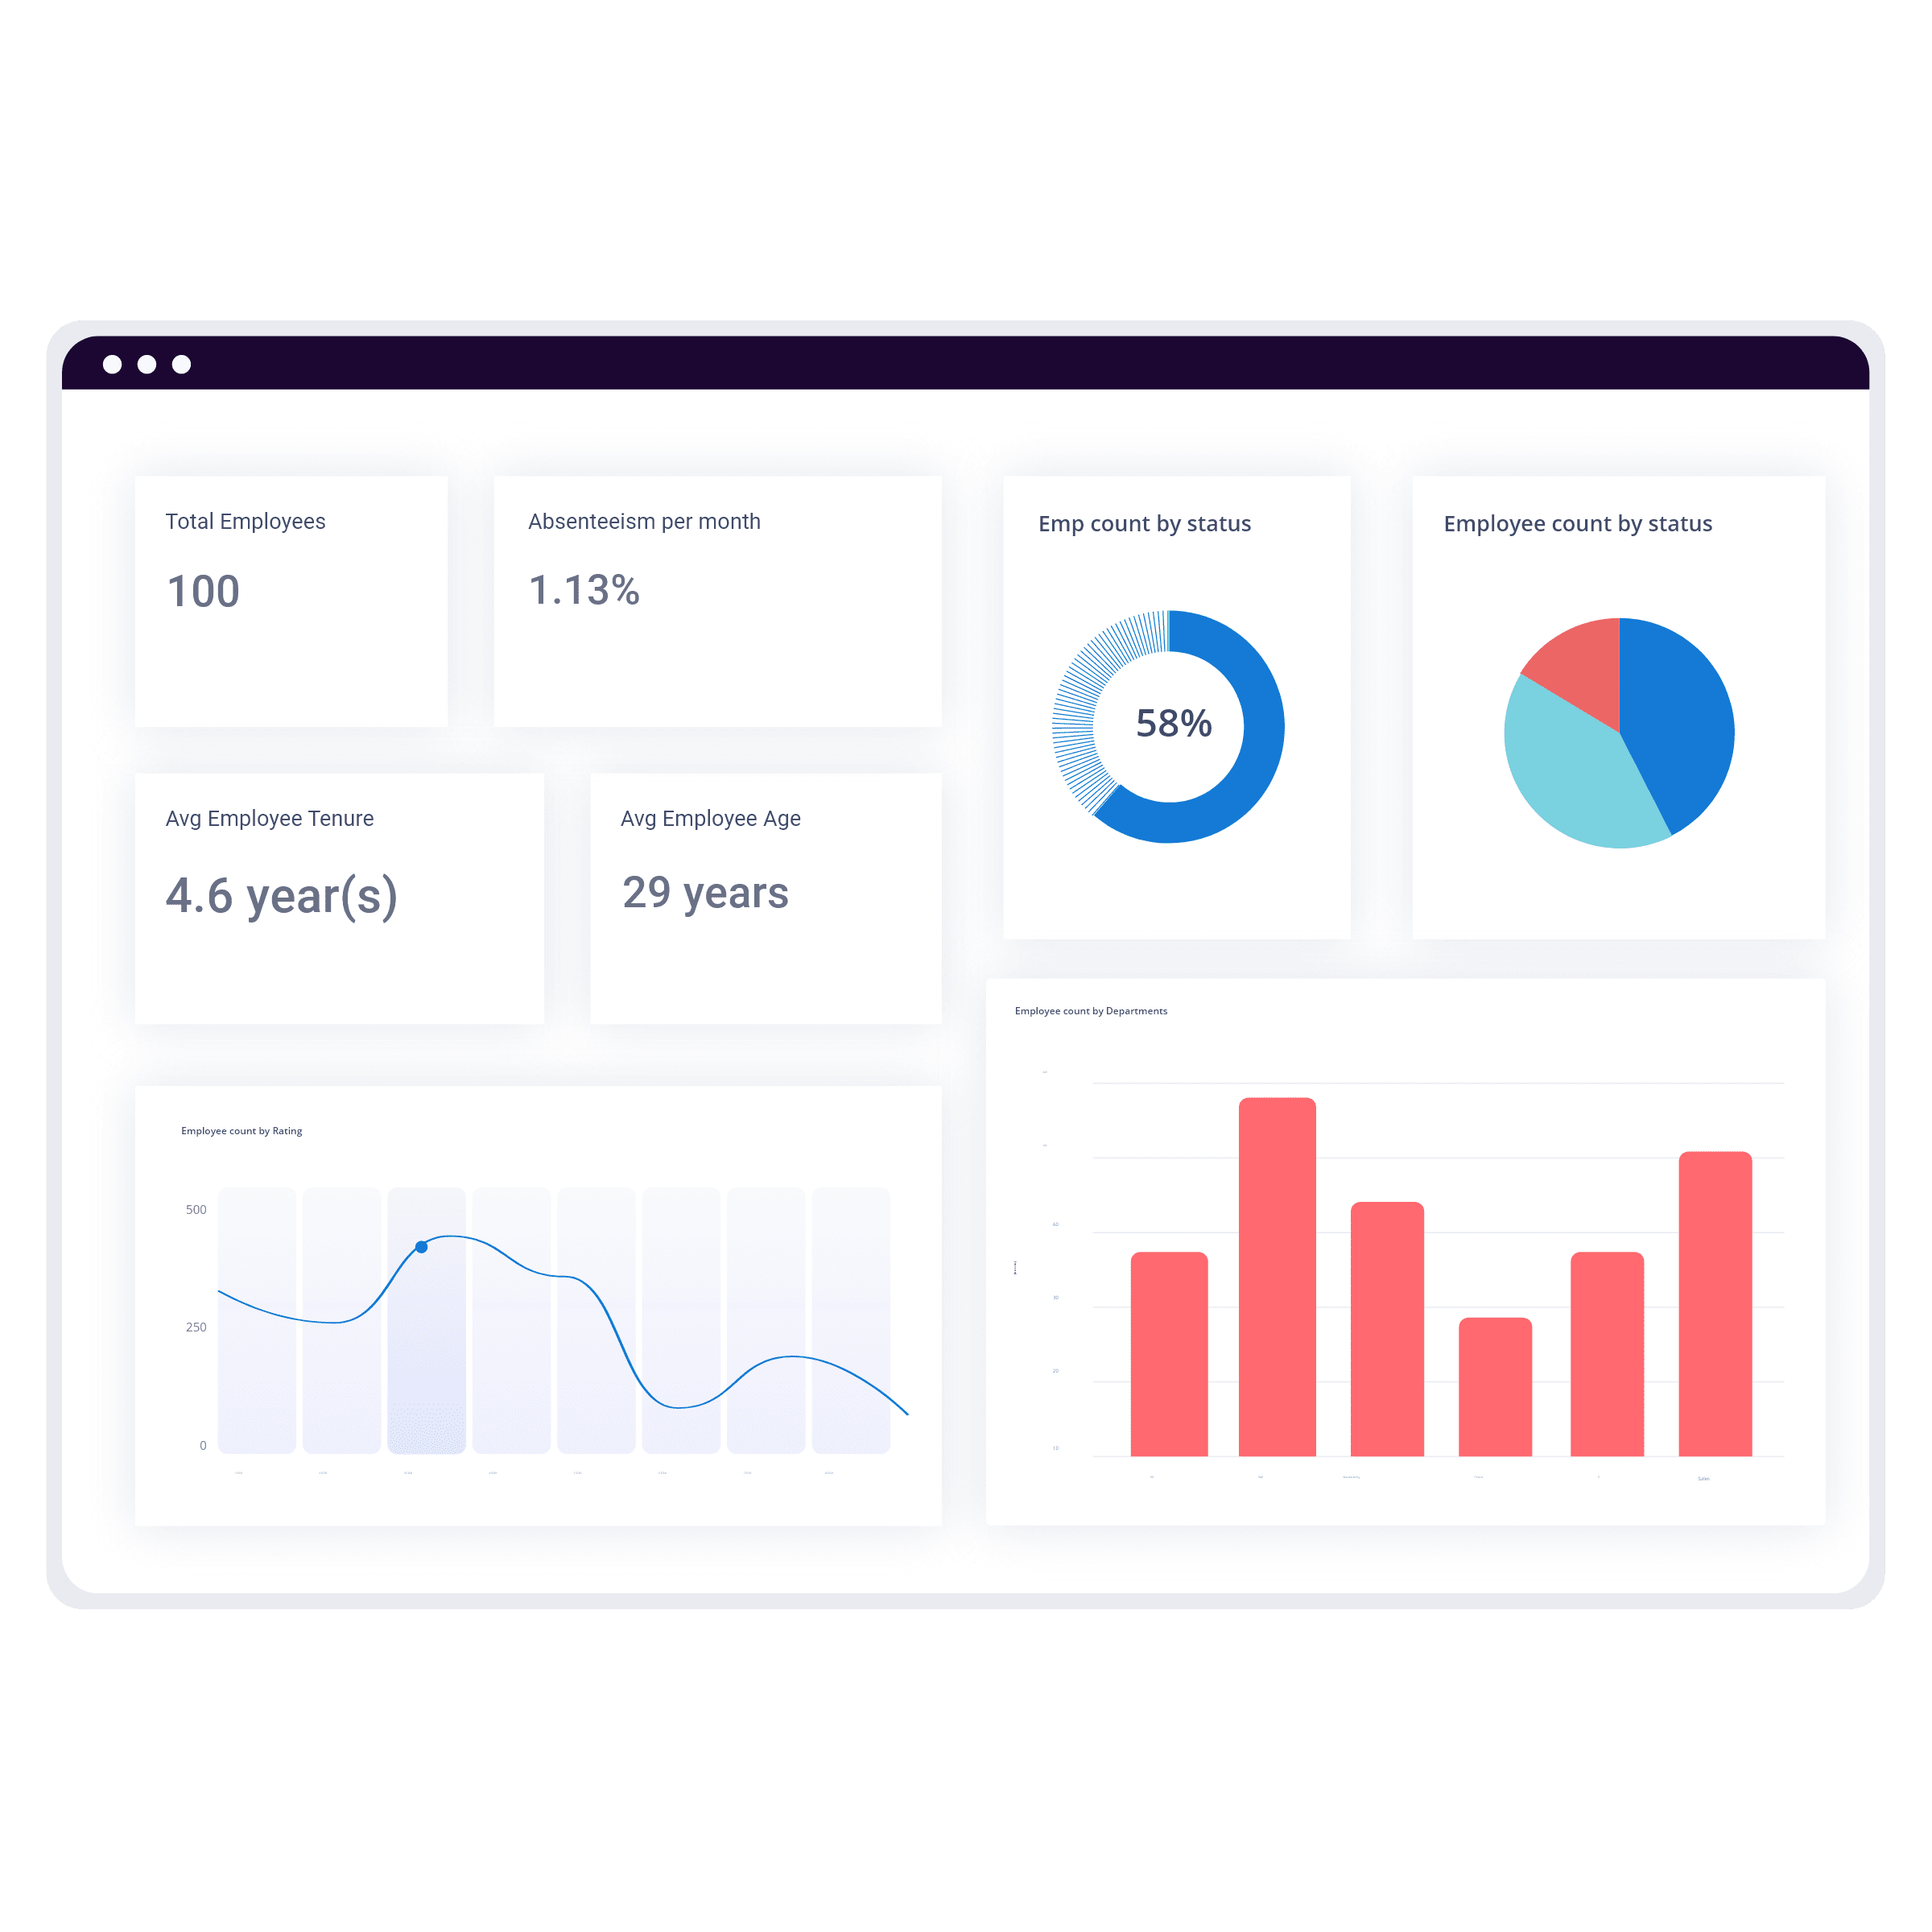
Platform supports over 40+ chart types ranging from simple Bar, PIE, and Trendline to complex chart types like Heatmaps, Funnel, and Area charts

Can I share the reports over an Email?

#closeIcon

Yes, you can schedule the reports to be shared over email

Are the configured reports available on mobile devices?

#closeIcon

Yes, you can access all the configured reports on Android and iOS devices.

Can I configure my dashboard over famous analytics tools like Power BI, tableau?

#closeIcon

Yes you can send the data through APIs or FTP transfer over to any data visualization tool like PowerBI, or Tableau and configure your dashboards accordingly.

Start making data-driven decisions now

Get in touch with us to learn more about how you can transform your application needs.

Contact us